
Stop waiting two weeks for a report that's already outdated

Business intelligence
Power BI turns your scattered data into dashboards your team will actually use. Real-time visibility. No more conflicting spreadsheets. No more "which number is right?"
Free assessment
No obligation
Actionable inisghts

sound familiar?
Everyone has their own version of the numbers
Finance says revenue is R12M. Sales says R14M. The CEO gets two different reports and trusts neither. Your team spends more time arguing about data than acting on it.
Reports take days to build and they're stale by the time they arrive
Someone exports from the ERP, cleans it in Excel, builds the pivot table, formats it for the board. By Thursday the numbers have already changed.
You can't answer simple questions without IT
"What were our margins by region last quarter?" should be a 30-second answer. Instead it's a request to IT, a two-week wait, and a report that doesn't quite answer the question.
What your team will actually use
One system for everything that matters
Interactive Dashboards
360-degree views of your business with drag-and-drop
Build stunning dashboards that update automatically. Drill down from company-wide metrics to individual transactions. Share securely across Teams, SharePoint, and mobile.
Why it matters
Your Monday morning leadership meeting runs on live data, not last week's export.
Natural Language Q&A
Ask questions, get visuals
Type "What were our sales by region last quarter?" and Power BI generates the chart. Copilot goes further, generating entire reports and complex DAX measures from descriptions.
Why it matters
Anyone on your team can explore data without training or SQL knowledge.
Real-Time Intelligence
Live data streams with sub-second latency
Monitor IoT streams, operational data, and transactional systems in real time. Perfect for manufacturing floor monitoring, fraud detection, and inventory tracking.
Why it matters
You see problems as they happen, not after month-end.
Semantic Modelling
One definition of every metric, used everywhere
A unified semantic layer through Fabric IQ ensures every department uses the same definitions for revenue, margin, and cost. No more conflicting numbers.
Why it matters
Finance and sales finally agree on what "revenue" means.
THE AI advantage
From reports to reasoning
Power BI has evolved from a visualisation tool into an AI-powered data intelligence platform. As part of Microsoft Fabric, it doesn't just show you what happened. It tells you why, and what to do next.
Fabric
Zero-copy data through OneLake
Power BI connects directly to your data lake through Microsoft Fabric. No data duplication. No import delays. Analytics run on your single source of truth.
Copilot
Ask questions in plain English
Ask multi-step questions like "Why did our North American margins dip in Q3?" and get a synthesised explanation covering price, supply chain, and competitor factors.
Agent
AI Data Agents that monitor your KPIs
Proactive agents watch your metrics and trigger workflows in Power Automate when thresholds are breached. You don't check dashboards. Dashboards check on you.
WHY THIS SOLUTION?
Why Power BI leads in 2026
Gartner consistently ranks Power BI as a Leader in Analytics & BI Platforms. Here's why.
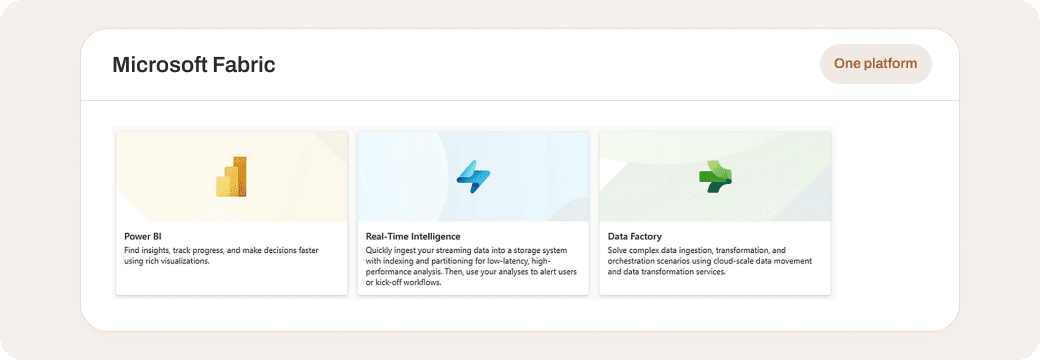
Microsoft Fabric integration
Unlike standalone BI tools, Power BI is natively unified with data engineering, data science, and real-time analytics in Microsoft Fabric. One platform for everything.
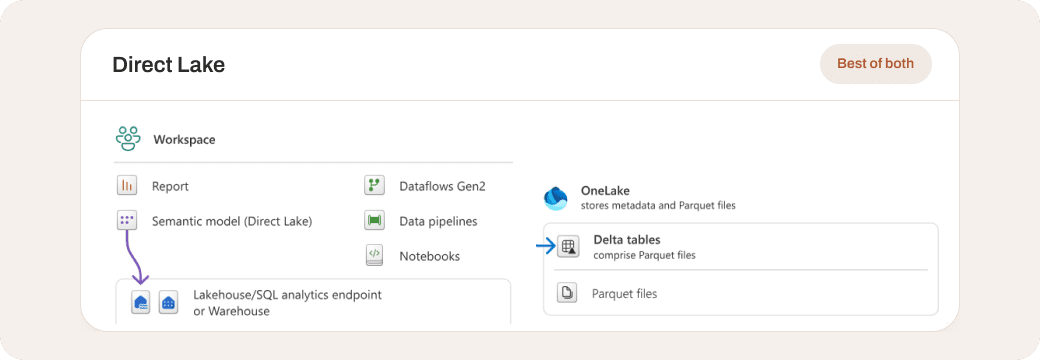
Direct Lake technology
Skip the "Import vs DirectQuery" trade-off. Direct Lake analyses massive datasets at import speed without moving the data. Best of both worlds.
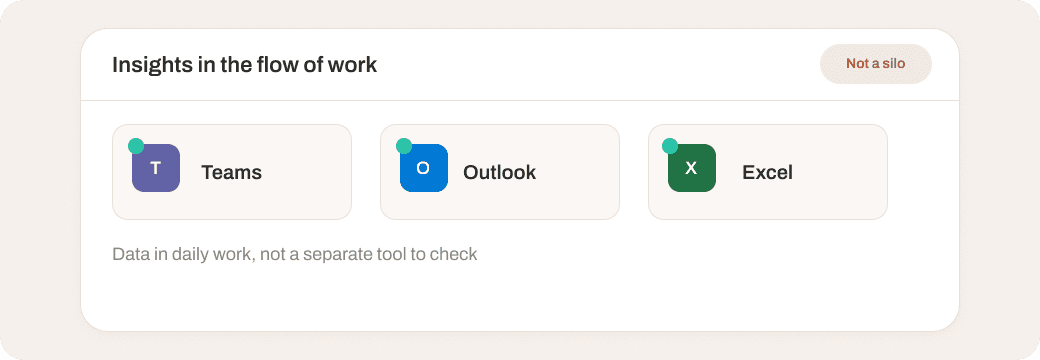
Deepest Microsoft 365 integration
Insights surface directly in BC, Teams, Outlook, and Excel. Your team sees data in the flow of daily work, not in a separate tool they forget to check.
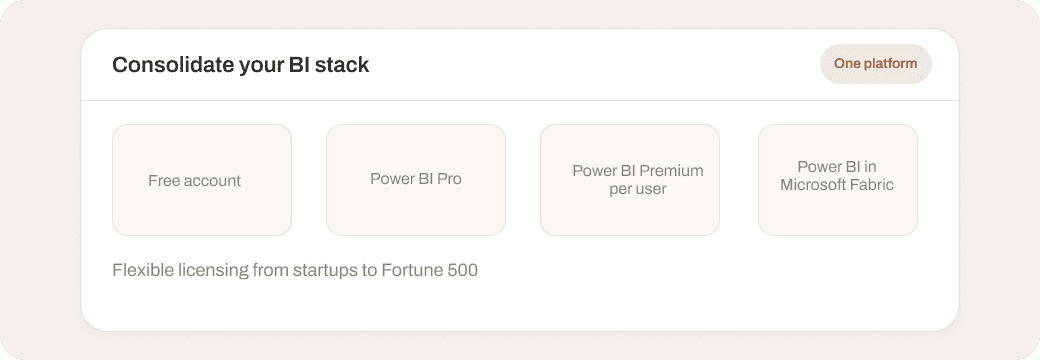
Cost-effective at scale
Flexible licensing makes enterprise-grade analytics accessible to businesses of all sizes. Consolidate fragmented BI tools into one platform.
80%
reduction in data-to-insight time with AI-assisted report generation
Source:
Microsoft
#1
Gartner Magic Quadrant Leader for Analytics & BI Platforms
Source:
Microsoft
3x
faster month-end reporting with automated dashboards
Source:
Microsoft
why your partner matters
We make sure your team actually uses it
We don't just build dashboards. We build a data culture. Our BI methodology ensures the right people see the right metrics, and we train your team to build their own reports so they're not dependent on us.
Our BI projects follow a proven methodology designed to deliver your business insights and help drive informed decisions.
We establish a Centre of Excellence for standards, templates, and best practices your team can maintain.


our customers
Businesses using Power BI with allonline365




Digby Wells Environmental International



Secutel Technologies